Profiling CUDA GEMM Kernels: 2D Block Tiling vs Vectorized Loads
Introduction
Matrix multiplication on GPUs is arguably the most important algorithm in deep learning, forming the
computational core of transformer training and inference. In this worklog, I profile and compare two CUDA SGEMM
(Single-precision General Matrix Multiply) implementations: a baseline 2D block-tiled GEMM and
a highly optimized vectorized variant that replaces scalar loads and stores with 128-bit
float4 instructions.
My analysis and kernel iterations are heavily based on Simon Boehm's excellent work on GPU matrix multiplication
optimization from his blog post How to
Optimize a CUDA Matmul Kernel. Using his kernel implementations, I've run end-to-end benchmarking on an
NVIDIA RTX A6000 GPU and used NVIDIA's developer profiling toolchain - Nsight Systems
(nsys) and Nsight Compute (ncu) - to pinpoint exactly how memory
layout, shared memory bank conflicts, and register pressure influence achieved performance.
You can find the full CUDA source files, run scripts, and further explanation of the optimized kernels in my GitHub repository: DaSH-Lab-Induction-Assignment-2025.
Background: Key Concepts
Before diving into code and numbers, a few definitions that will reappear throughout this post.
FLOPs and GFLOPS. A FLOP is a single floating-point operation (addition or multiplication). GFLOPS is billions of such operations per second. For a square GEMM of size M=N=K, the operation count is approximately 2·M·N·K (one multiply and one add per inner product step). Hardware peak on the A6000 is ~38.7 TFLOPS in FP32.
Arithmetic Intensity. Defined as FLOPs performed divided by bytes moved from memory. A kernel with high arithmetic intensity reuses data many times per byte loaded and can be compute-bound. A kernel with low arithmetic intensity is starved for data and is memory-bound.
The Roofline Model. A graph with performance (GFLOPS) on the Y-axis and arithmetic intensity on the X-axis. Two "roofs" cap performance: a flat horizontal line at peak compute throughput, and a slanted diagonal line representing peak memory bandwidth. If a kernel's dot sits on the slanted line, it is memory-bound - more math per byte (better tiling, more reuse) is the path forward. Maximum Achievable Performance = Memory Bandwidth × Arithmetic Intensity
Warps. The GPU executes 32 threads at a time as a group called a warp. All 32 threads in a warp execute the same instruction simultaneously on different data. The GPU scheduler's job is to find a warp that is ready to execute and issue its instruction every cycle. If no warp is ready (they are all stalled waiting for memory), the issue slot goes to waste.
Occupancy. The ratio of active warps on an SM to the maximum warps that SM can hold. Higher occupancy gives the scheduler more warps to choose from, hiding memory latency. Occupancy is limited by whichever resource runs out first: registers, shared memory, or warp slots.
Memory coalescing. When threads in a warp access contiguous memory addresses, the GPU can
satisfy all 32 accesses in a single 128-byte transaction (called a cache line or sector). When threads access
scattered addresses, the GPU must issue multiple transactions - wasted bandwidth. The metric reported by ncu is bytes utilized per 32-byte sector: ideally 32/32, poor is 4/32.
Shared memory bank conflicts. Shared memory is divided into 32 banks. A single warp can access 32 different banks simultaneously. If two or more threads in a warp hit the same bank (but different addresses), those accesses are serialized. This is a bank conflict - a 4-way conflict means a single logical transaction takes 4 hardware transactions.
The Profiling Toolchain
NVIDIA provides two complementary tools that work together.
Nsight Systems (nsys): This is a system-wide
timeline profiler. It records the CPU, the GPU, OS system calls, and all data transfers. It does not look inside
a kernel; it just tells you where time is going and which kernels are taking the longest. The key questions to
answer with nsys: Is the GPU sitting idle between launches? Is cudaMemcpy dominating the timeline? Which kernel accounts for 80% of GPU time?
Nsight Compute (ncu): Once nsys tells
you which kernel is slow, you use ncu to look
inside that exact kernel and find out why. It replays the kernel up to 37 times under different hardware
counters to build a complete picture of compute throughput, memory access patterns, scheduler efficiency, and
occupancy.
The commands used in this post:
# System-wide profiling (captures the full program timeline)
nsys profile -o 1d_tiling_timeline -t cuda,nvtx,osrt --stats=true ./1D_block_tiling

# Print summary tables from a .nsys-rep file
nsys stats --force-export=true 1d_tiling_timeline.nsys-rep

# Compiling
nvcc -O3 -lineinfo -arch=sm_86 -lcublas -o 1D_block_tiling 1D_block_tiling.cu

# Deep kernel profiling: skip 1 launch (warm-up), profile 1 launch (4096 is just matrix size)
sudo $(which ncu) --set full -s 1 -c 1 ./2D_block_tiling 4096
The -s 1 flag skips the first kernel launch (the warm-up), and -c 1 profiles exactly one launch. This ensures we are profiling the real 4096×4096
workload, not the tiny warm-up launch that would produce misleading near-zero throughput numbers.
The Two Kernels
Kernel 1: 2D Block Tiling
The 2D block-tiled kernel is the natural next step after 1D tiling. Instead of each thread computing a single
output element, each thread computes a TM × TN sub-tile of results using register
blocking. The block collectively loads a BM × BK tile of A and a BK × BN tile of B into shared memory, then performs the outer-product accumulation in
registers. With BM = BN = 128, BK = 8, TM = TN = 8, each 256-thread block produces a 128×128 output tile.
template <const int BM, const int BN, const int BK, const int TM, const int TN>
__global__ void __launch_bounds__((BM * BN) / (TM * TN), 1)
sgemm2DBlocktiling(int M, int N, int K, float alpha, const float *A,
                   const float *B, float beta, float *C)
{
    // -----------------------------------------------------------------
    // 1) Identify the output tile this block will compute
    // -----------------------------------------------------------------
    const uint cRow = blockIdx.y;                     // tile‑row index
    const uint cCol = blockIdx.x;                     // tile‑col index
    const uint totalResultsBlocktile = BM * BN;        // #output elements per tile

    // A thread produces TM × TN results inside the tile
    const uint numThreadsBlocktile = totalResultsBlocktile / (TM * TN);
    // sanity check – the launch must provide exactly this many threads
    assert(numThreadsBlocktile == blockDim.x);

    // BN/TN threads span a column of the tile
    const int threadCol = threadIdx.x % (BN / TN);
    const int threadRow = threadIdx.x / (BN / TN);

    // -----------------------------------------------------------------
    // 2) Shared‑memory tiles for A and B
    // -----------------------------------------------------------------
    __shared__ float As[BM * BK];
    __shared__ float Bs[BK * BN];

    // Move the global pointers to the first element of this tile
    A += cRow * BM * K;                     // start of A‑tile rows
    B += cCol * BN;                         // start of B‑tile columns
    C += cRow * BM * N + cCol * BN;         // start of C‑tile

    // -----------------------------------------------------------------
    // 3) Indices used for loading the shared‑memory tiles
    // -----------------------------------------------------------------
    const uint innerRowA = threadIdx.x / BK;
    const uint innerColA = threadIdx.x % BK;
    const uint strideA   = numThreadsBlocktile / BK;   // rows of A loaded per step

    const uint innerRowB = threadIdx.x / BN;
    const uint innerColB = threadIdx.x % BN;
    const uint strideB   = numThreadsBlocktile / BN;   // rows of B loaded per step

    // -----------------------------------------------------------------
    // 4) Thread‑local accumulators (register‑blocked)
    // -----------------------------------------------------------------
    float threadResults[TM * TN] = {0.0f};   // final TM × TN results for this thread
    float regM[TM] = {0.0f};                // registers for a column of A
    float regN[TN] = {0.0f};                // registers for a row    of B

    // -----------------------------------------------------------------
    // 5) Main K‑loop – load tiles, compute, advance pointers
    // -----------------------------------------------------------------
    for (uint bkIdx = 0; bkIdx < K; bkIdx += BK)
    {
        // ---- load a BM×BK tile of A into shared memory -----------------
        for (uint loadOffset = 0; loadOffset < BM; loadOffset += strideA)
        {
            As[(innerRowA + loadOffset) * BK + innerColA] =
                A[(innerRowA + loadOffset) * K + innerColA];
        }

        // ---- load a BK×BN tile of B into shared memory -----------------
        for (uint loadOffset = 0; loadOffset < BK; loadOffset += strideB)
        {
            Bs[(innerRowB + loadOffset) * BN + innerColB] =
                B[(innerRowB + loadOffset) * N + innerColB];
        }

        __syncthreads();

        // ---- advance global pointers to the next K‑chunk ----------------
        A += BK;          // move right by BK columns in A
        B += BK * N;      // move down by BK rows in B

        // ---- compute the partial products for this K‑chunk ------------
        // 2‑D block tiling – each thread produces TM × TN results
        for (uint dotIdx = 0; dotIdx < BK; ++dotIdx) // iterates over K-tiles
        {
            // load TM elements of the current column of A (one per row) into registers
            for (uint i = 0; i < TM; ++i)
                regM[i] = As[(threadRow * TM + i) * BK + dotIdx];
                // regM holds A[ row = threadRow*TM+i , col = dotIdx ]

            // load TN elements of the current row of B (one per column) into registers
            for (uint i = 0; i < TN; ++i)
                regN[i] = Bs[dotIdx * BN + threadCol * TN + i];
                // regN holds B[ row = dotIdx , col = threadCol*TN+i ]

            // outer‑product of the two vectors → TM×TN partial result, accumulate TM × TN products
            for (uint resIdxM = 0; resIdxM < TM; ++resIdxM)
            {
                for (uint resIdxN = 0; resIdxN < TN; ++resIdxN)
                {
                    threadResults[resIdxM * TN + resIdxN] +=
                        regM[resIdxM] * regN[resIdxN];
                        // each combination (row, col) of the mini‑matrix gets one product
                }
            }
        }

        __syncthreads();   // ensure all threads finished before next tile
    }

    // -----------------------------------------------------------------
    // 6) Write the TM × TN results back to global memory
    // -----------------------------------------------------------------
    for (uint resIdxM = 0; resIdxM < TM; ++resIdxM)
    {
        for (uint resIdxN = 0; resIdxN < TN; ++resIdxN)
        {
            uint globalRow = (threadRow * TM + resIdxM);
            uint globalCol = (threadCol * TN + resIdxN);
            C[globalRow * N + globalCol] =
                alpha * threadResults[resIdxM * TN + resIdxN] +
                beta  * C[globalRow * N + globalCol];
        }
    }
}
Kernel 2: Vectorized Loads
The vectorized kernel makes two targeted changes to the 2D tiling kernel. First, it replaces the scalar float loads for both A and B with float4 loads - a single
128-bit instruction that brings in 4 floats at once. Second, to enable this for A (which is loaded in a
transposed layout), it transposes A on-the-fly while writing into shared memory. Third, it writes results back
to C using float4 stores, four outputs at a time.
// ---------------------------------------------------------------------
// Kernel – 2‑D block tiling with vectorised loads/stores
// ---------------------------------------------------------------------
template
__global__ void __launch_bounds__((BM * BN) / (TM * TN), 1)
Vectorize(int M, int N, int K,
               float alpha, float *A,
               float *B, float beta, float *C)
{
    // -------------------------------------------------------------
    // 1) Identify the output tile this block will compute
    // -------------------------------------------------------------
    const uint cRow = blockIdx.y;                     // tile‑row index
    const uint cCol = blockIdx.x;                     // tile‑col index

    // BN/TN threads span a column of the tile
    const int threadCol = threadIdx.x % (BN / TN);
    const int threadRow = threadIdx.x / (BN / TN);

    // -------------------------------------------------------------
    // 2) Shared‑memory tiles for A and B
    // -------------------------------------------------------------
    __shared__ float As[BM * BK];
    __shared__ float Bs[BK * BN];

    // Move the global pointers to the first element of this tile
    A += cRow * BM * K;                     // start of A‑tile rows
    B += cCol * BN;                         // start of B‑tile columns
    C += cRow * BM * N + cCol * BN;         // start of C‑tile

    // -------------------------------------------------------------
    // 3) Indices used for loading the shared‑memory tiles
    //    (vectorised: 4 floats == one float4 per thread)
    // -------------------------------------------------------------
    const uint innerRowA = threadIdx.x / (BK / 4);
    const uint innerColA = threadIdx.x % (BK / 4);
    const uint innerRowB = threadIdx.x / (BN / 4);
    const uint innerColB = threadIdx.x % (BN / 4);

    // -------------------------------------------------------------
    // 4) Thread‑local accumulators (register‑blocked)
    // -------------------------------------------------------------
    float threadResults[TM * TN] = {0.0f};
    float regM[TM] = {0.0f};
    float regN[TN] = {0.0f};

    // -------------------------------------------------------------
    // 5) Main K‑loop – load tiles, compute, advance pointers
    // -------------------------------------------------------------
    for (uint bkIdx = 0; bkIdx < K; bkIdx += BK)
    {
        // ---- load a BM×BK tile of A (transpose while loading) ----
        float4 tmpA = reinterpret_cast(&A[innerRowA * K + innerColA * 4])[0];
        As[(innerColA * 4 + 0) * BM + innerRowA] = tmpA.x;
        As[(innerColA * 4 + 1) * BM + innerRowA] = tmpA.y;
        As[(innerColA * 4 + 2) * BM + innerRowA] = tmpA.z;
        As[(innerColA * 4 + 3) * BM + innerRowA] = tmpA.w;

        // ---- load a BK×BN tile of B (no transpose) ---------------
        reinterpret_cast(&Bs[innerRowB * BN + innerColB * 4])[0] =
            reinterpret_cast(&B[innerRowB * N + innerColB * 4])[0];

        __syncthreads();

        // ---- advance global pointers to the next K‑chunk ----------
        A += BK;          // move right by BK columns in A
        B += BK * N;      // move down by BK rows in B

        // ---- compute the partial products for this K‑chunk -------
        for (uint dotIdx = 0; dotIdx < BK; ++dotIdx)
        {
            // load TM elements of the current column of A into registers
            for (uint i = 0; i < TM; ++i)
                regM[i] = As[dotIdx * BM + threadRow * TM + i];

            // load TN elements of the current row of B into registers
            for (uint i = 0; i < TN; ++i)
                regN[i] = Bs[dotIdx * BN + threadCol * TN + i];

            // accumulate TM × TN products
            for (uint m = 0; m < TM; ++m)
                for (uint n = 0; n < TN; ++n)
                    threadResults[m * TN + n] += regM[m] * regN[n];
        }

        __syncthreads();   // ensure all threads finished before next tile
    }

    // -------------------------------------------------------------
    // 6) Write the TM × TN results back to global memory (vectorised)
    // -------------------------------------------------------------
    for (uint m = 0; m < TM; ++m)
    {
        for (uint n = 0; n < TN; n += 4)   // store 4 floats at a time
        {
            // load existing C values as a float4
            float4 tmpC = reinterpret_cast(
                &C[(threadRow * TM + m) * N + threadCol * TN + n])[0];

            // GEMM update
            tmpC.x = alpha * threadResults[m * TN + n]     + beta * tmpC.x;
            tmpC.y = alpha * threadResults[m * TN + n + 1] + beta * tmpC.y;
            tmpC.z = alpha * threadResults[m * TN + n + 2] + beta * tmpC.z;
            tmpC.w = alpha * threadResults[m * TN + n + 3] + beta * tmpC.w;

            // write back
            reinterpret_cast(
                &C[(threadRow * TM + m) * N + threadCol * TN + n])[0] = tmpC;
        }
    }
}
The inner computation loop - the outer-product accumulation - is identical between the two kernels. The only differences are in how data enters shared memory and how results leave to global memory.
Part 1 - The nsys Report: System-Wide Picture
Running nsys stats on both programs gives us the OS Runtime Summary, CUDA API
Summary, GPU Kernel Summary, and memory transfer summaries. Let's walk through each in order.
OS Runtime Summary
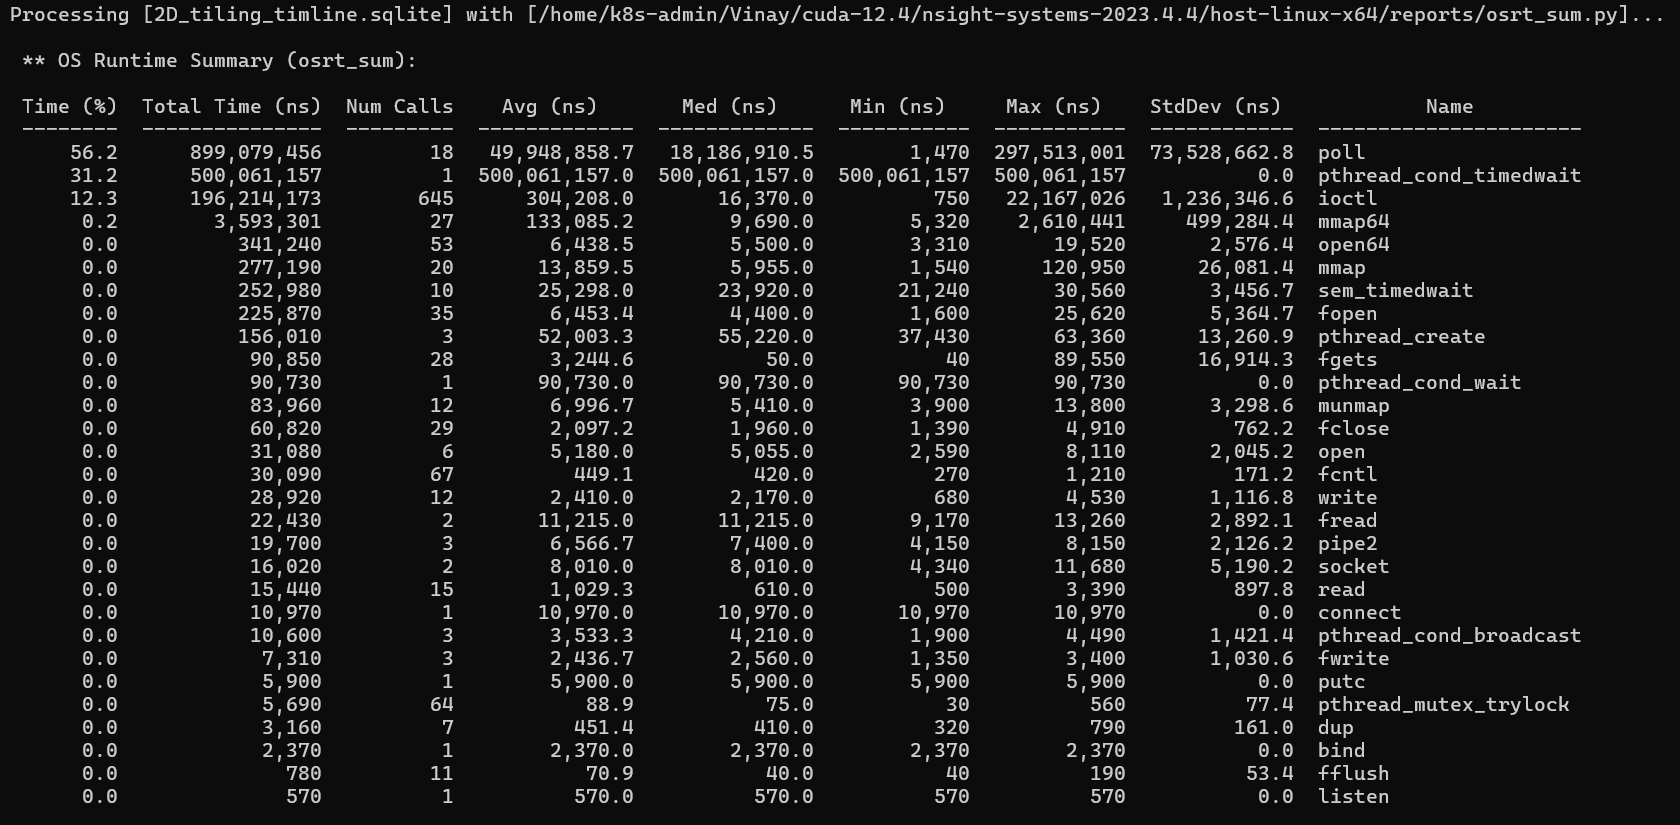
This table shows time the CPU spent inside Linux system calls. The columns are: Time (%) - fraction of total CPU-side time; Num Calls - how many times this function was called; Avg / Med / Min / Max - per-call durations; StdDev - how much individual call durations varied.
The Min/Max columns are where we often get confused. Take poll - in the 2D
tiling run it shows an Avg of ~50ms but a Min of 1,470ns and a Max of 297ms. This does not mean the program was
slow; it means most poll calls returned instantly (the GPU had already finished) and
a few blocked for nearly 300ms (the CPU was waiting for a long kernel). The wide gap between average and max
signals outliers.
The two entries that dominate both runs are poll (~55%) and pthread_cond_timedwait (~33%). Both are blocking wait calls - the CPU is sitting idle,
waiting for the GPU. This is exactly what you want in a GPU program. The 500ms pthread_cond_timedwait is the CUDA runtime's background thread waiting for GPU work to
arrive - it is not your code.
The ioctl calls (~13%) are the CUDA driver communicating with the GPU kernel module
- every kernel launch, every synchronization, every memory operation passes through ioctl under the hood.
poll and pthread_cond_timedwait percentages mean the CPU is patiently waiting for the GPU. This
is healthy. If you saw heavy mmap or malloc calls in
your hot path, that would indicate a CPU-side performance problem.
CUDA API Summary
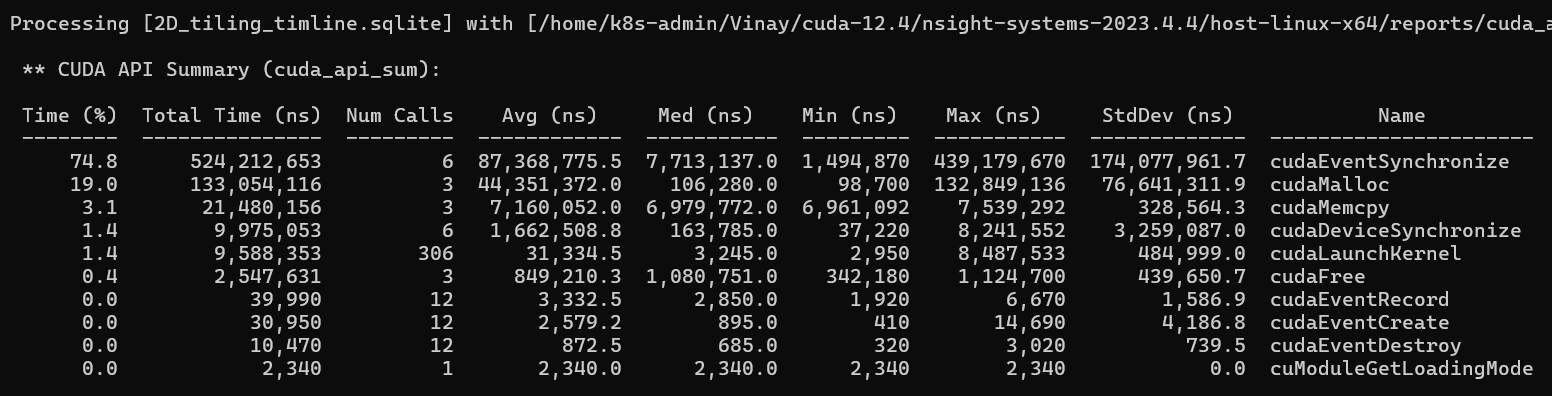
This table shows time spent in CUDA host API calls - the calls your C++ code makes to the runtime.
In the 2D tiling run, cudaEventSynchronize takes 74.8% of total time (524ms across 6
calls, one per problem size). This is the CUDA_CHECK(cudaEventSynchronize(stop)) in
the timing loop - the CPU waiting for the GPU to finish all 50 timed launches. The Min (1.5ms) is the 128×128
problem and the Max (439ms) is the accumulated time for the 4096×4096 problem with 50 repeats. This is expected
behavior, not a bug.
cudaMalloc takes 19% (133ms). The first call is always slow - 132ms for the first
versus ~100µs for subsequent calls - because the first cudaMalloc initializes the
entire CUDA context and CUDA driver. This is a one-time cost.
cudaMemcpy takes 3.1% (21ms) - three copies of a 4096×4096 float matrix (each 67MB,
201MB total). About 7ms per copy gives approximately 9.5 GB/s, consistent with PCIe Gen4 bandwidth.
cudaLaunchKernel takes 1.4% (9.5ms across 306 launches). 306 = 6 sizes × (1 warm-up
+ 50 timed runs). The average is ~31µs per launch call, but the Max is 8.5ms - the first launch for each new
size is slower because CUDA may perform just-in-time work for the first invocation of each configuration.
GPU Kernel Summary - the most important nsys table

The 2D tiling kernel ran 306 instances spanning all six problem sizes (128 to 4096). This produces a wildly heterogeneous distribution: Avg 1.75ms, Median 0.16ms, Min 32µs, Max 8.88ms, StdDev 3.18ms. The median is so much smaller than the average because the small problem sizes (128, 256) pull the median down while the 4096 runs (which take ~8.9ms each) pull the average up.
The vectorize program was configured differently - it only ran the 4096×4096 problem (51 instances: 1 warm-up + 50 timed). This produces a tight distribution: Avg 7.57ms, Median 7.63ms, Min 6.94ms, Max 7.84ms, StdDev 229µs. All 51 launches are the same problem, so the kernel time is consistent.
Memory Transfer Summary

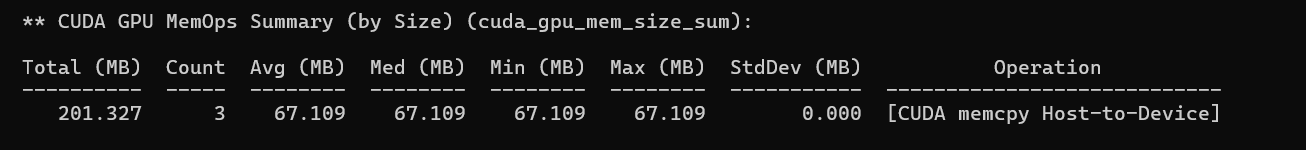
Both programs transferred 201.3MB host-to-device (three 67MB matrices) and zero bytes device-to-host. The results stay on the GPU - the programs never read C back to the CPU. Transfer time was ~7ms per copy in both runs, consistent across the board. There is nothing to optimize here; this is a one-time setup cost outside the timed loop.
Part 2 - The ncu Report: Inside the Kernel
Both kernels were profiled with ncu --set full -s 1 -c 1 at 4096×4096. The launch
configuration for both was identical: Grid 32×32×1, Block 256×1×1, 1024
total blocks, 262,144 threads.
2,142
Vectorize - GFLOPS (under profiling)
1,024
2D Tiling - GFLOPS (under profiling)
2.1×
Vec speedup over Tiling
Note that ncu adds significant profiling overhead (37 replay passes), so absolute GFLOPS numbers are lower than the clean non-profiled runs. The ratio between the two kernels is what matters.
Section: GPU Speed of Light Throughput
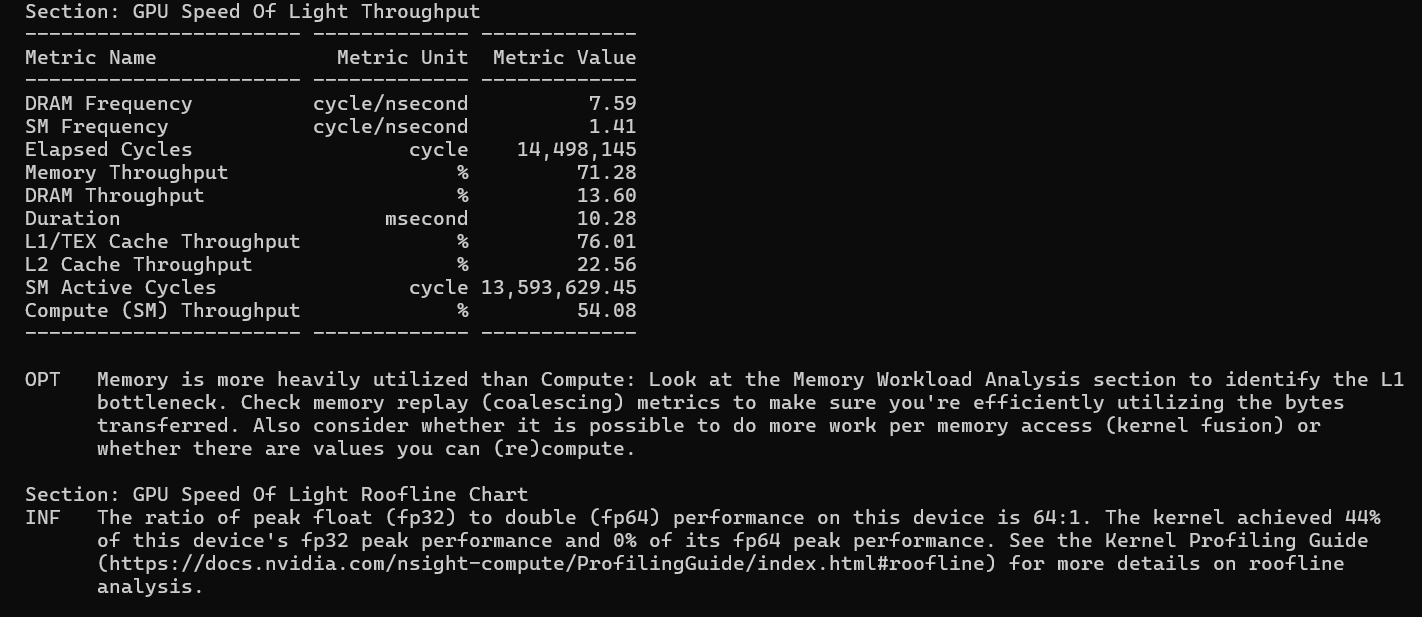
This section answers: of everything this GPU can do, what fraction are you using? Every number is a percentage of hardware peak.
The most important observation here is that for both kernels, Memory Throughput (~79% and ~71%) significantly exceeds Compute Throughput (~59% and ~54%). ncu flags this explicitly: "Memory is more heavily utilized than Compute - look at the Memory Workload Analysis section to identify the L1 bottleneck."
Both kernels are memory-bound. The L1/TEX cache is the tallest bar in both cases - shared memory accesses travel through L1/TEX, so the inner computation loop, which reads heavily from shared memory, is saturating the L1 cache bandwidth. The DRAM bars are low (14–16%) because shared memory tiling is doing its job: most data comes from L1, not from DRAM.
The roofline chart confirms this: Vectorize achieves 52% of FP32 peak and Tiling achieves 44%. Both sit on the memory bandwidth slope of the roofline, not on the compute ceiling. The path to higher performance is not faster math - it is better memory access patterns.
Section: Compute Workload Analysis
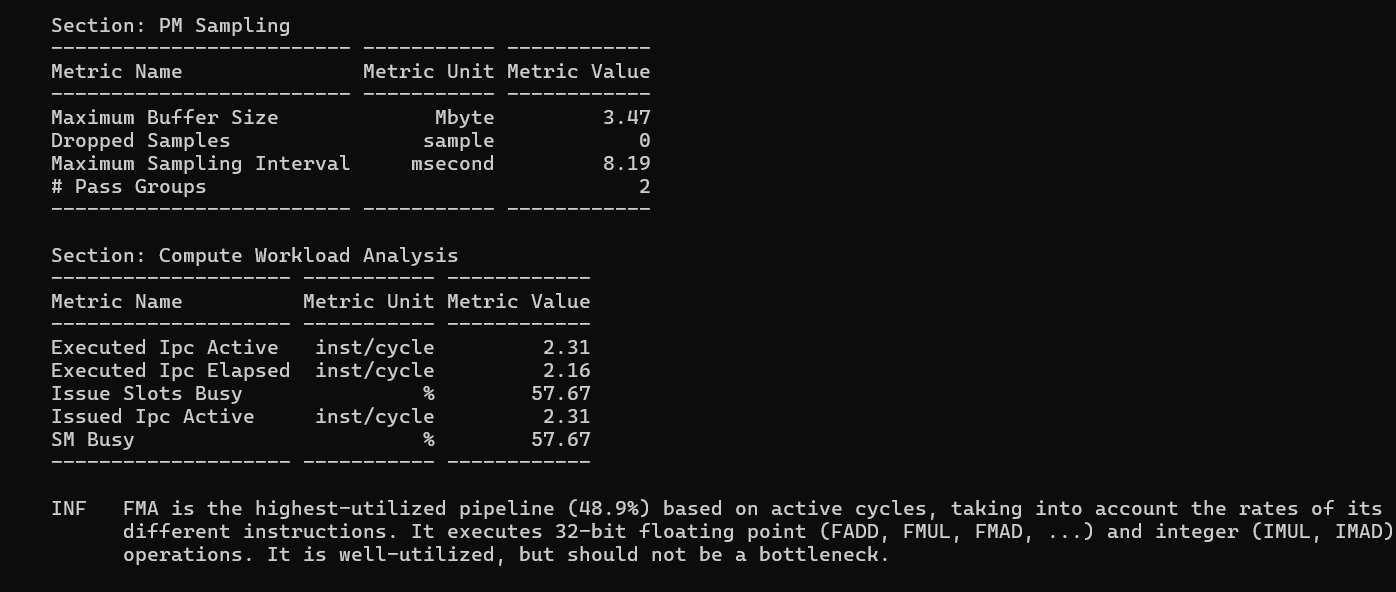
IPC (Instructions Per Cycle) measures how many instructions the SM executes per clock cycle. The theoretical maximum on the A6000 is 4 IPC. There are two variants: IPC Active (only counting cycles where the SM was doing something) and IPC Elapsed (averaged over all clock cycles including idle time).
| Metric | Vectorize | 2D Tiling |
|---|---|---|
| IPC Active (inst/cycle) | 2.52 | 2.31 |
| IPC Elapsed (inst/cycle) | 2.36 | 2.16 |
| Issue Slots Busy | 62.9% | 57.7% |
| FMA Pipeline Usage | 56.5% | 48.9% |
The IPC Active gap (2.52 vs 2.31) shows that Vectorize is getting more useful work done per active cycle. The
FMA pipeline - the hardware unit that executes Fused Multiply-Add instructions, which is exactly what your inner
loop threadResults[m*TN+n] += regM[m] * regN[n] compiles to - is 56.5% utilized in
Vectorize versus 48.9% in Tiling. Vectorize is spending proportionally more of its time doing real
floating-point math.
Section: Memory Workload Analysis
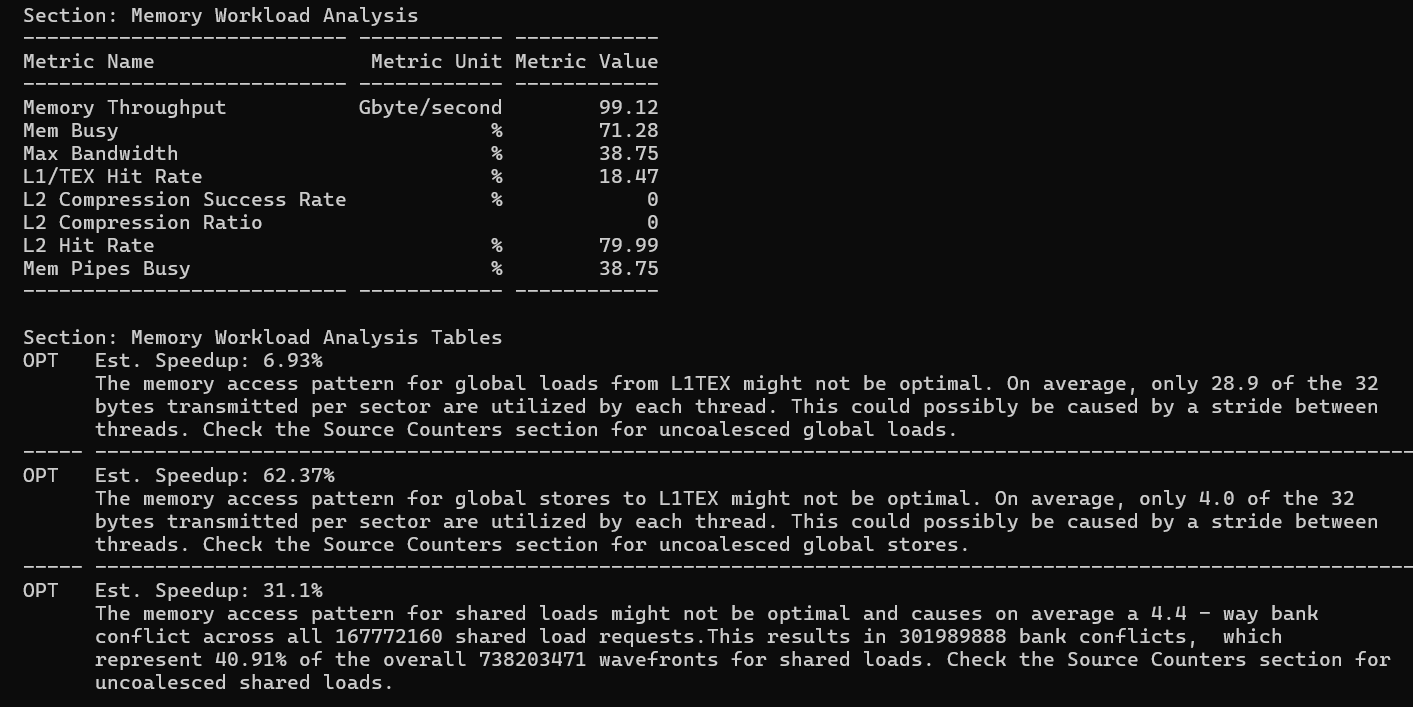
This is the most actionable section - it tells you exactly where memory bandwidth is being wasted and by how much.
| Access type | Vectorize | 2D Tiling | Winner |
|---|---|---|---|
| Global load bytes used/sector | 31.5 / 32 | 28.9 / 32 | Vec |
| Global store bytes used/sector | 16.0 / 32 | 4.0 / 32 | Vec much better |
| Shared load bank conflict rate | 40% | 40.9% | Tie |
| Shared store bank conflict rate | 33.3% | Not reported | Tiling better |
| L1/TEX Hit Rate | 4.5% | 18.5% | Tiling higher |
| L2 Hit Rate | 78.8% | 80.0% | ~Same |
| Absolute memory throughput | 116.3 GB/s | 98.6 GB/s | Vec higher |
| Excess global sectors (uncoalesced) | 3% of total | 18% of total | Vec much better |
Global memory coalescing is where float4 has the biggest impact. When threads in a warp each
issue a float4 load, 32 threads × 16 bytes = 512 bytes are brought in per warp in
one aligned transaction. The result: 98% of every fetched cache sector (31.5/32 bytes) is actually used. With
scalar loads in the Tiling kernel, only 28.9/32 bytes are used - not terrible, but measurably worse. For global
stores the difference is dramatic: Tiling uses only 4.0/32 bytes per sector (12.5% utilization), while Vectorize
reaches 16.0/32 (50%). This 4× improvement in store coalescing is the single largest performance factor
separating the two kernels.
Why are the Tiling stores so wasteful? Each thread writes a TM×TN = 64-element result sub-tile back to C. The
write pattern is: thread 0 writes rows threadRow*8 + 0..7 at columns threadCol*8 + 0..7; thread 1 writes the same row range at adjacent columns. These writes
are not contiguous in memory across a warp - they jump by the full matrix stride (4096 floats = 16384 bytes)
between rows. Each row write hits a different cache sector and only writes 4 bytes of a 32-byte sector, wasting
87.5% of the bandwidth.
float4 loads fetch 16 bytes per thread
from global memory on the way into shared memory, the GPU issues these as wide transactions that tend to bypass
or evict L1 - they go straight to L2 and shared memory. The data still arrives efficiently; it just doesn't show
up in L1 hit rate. The absolute throughput (116 GB/s vs 98.6 GB/s) confirms Vectorize is actually moving more
data faster.
Shared memory bank conflicts are essentially identical between the two kernels (~40% of shared
load wavefronts are "excessive"). This makes sense - the inner computation loop, which reads from As and Bs to fill regM and regN, is identical in both kernels. The vectorized loading into shared memory changed
the write pattern but not the read pattern.
The bank conflict math: GPU shared memory has 32 banks. As is stored as As[row * BK + col] with BK=8. When the inner loop reads As[(threadRow * TM + i) * BK + dotIdx], threads with different threadRow values access addresses spaced by TM * BK = 8 * 8 = 64 bytes apart. Since 64 bytes / 4 bytes per float = 16 floats, and 16
mod 32 banks = 16, adjacent threads hit banks that are 16 apart - creating 4-way conflicts. The fix: declare
float As[BM * (BK + 1)] (add 1 float of padding per row). This shifts each row's
starting bank by 1, breaking the conflict pattern entirely.
Vectorize also shows shared store bank conflicts (33.3% waste, 28% estimated speedup) that Tiling does not report. The float4 writes into shared memory during the A tile transpose create a new conflict pattern that scalar writes did not have. So Vectorize traded one form of inefficiency for another in this specific path.
Section: Scheduler Statistics and Warp State
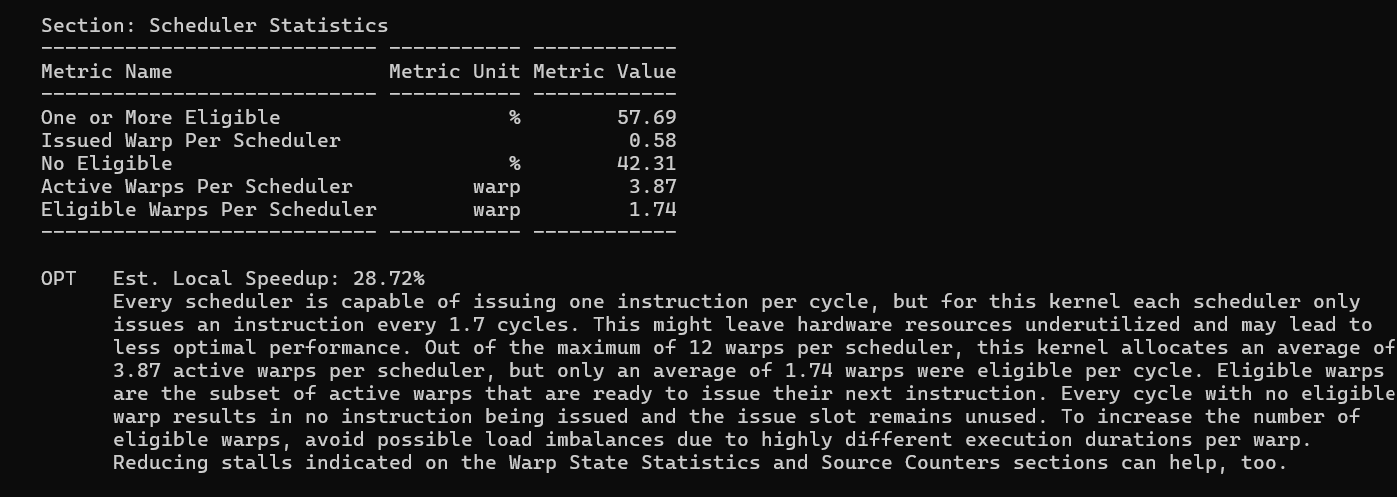
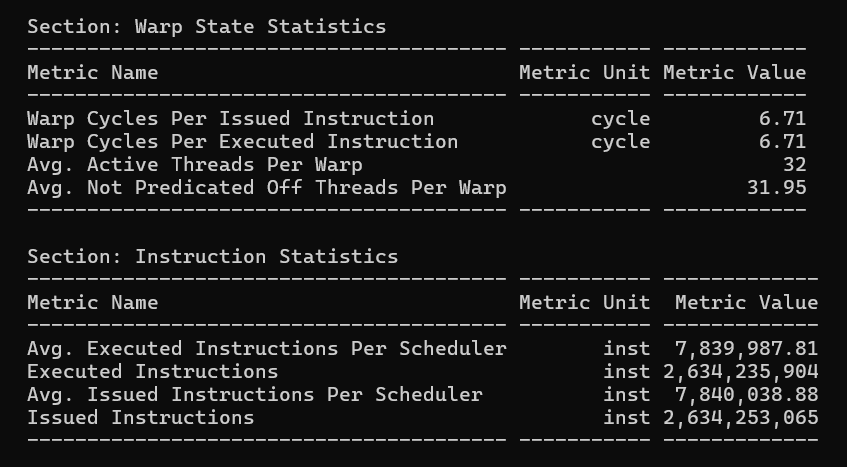
The scheduler's job is to find a warp ready to execute and issue an instruction every cycle. Here is the picture for both kernels:
| Metric | Vectorize | 2D Tiling |
|---|---|---|
| Cycles with eligible warp (scheduler busy) | 63.0% | 57.7% |
| Cycles with NO eligible warp (wasted) | 37.1% | 42.3% |
| Active warps per scheduler | 3.87 | 3.87 |
| Eligible warps per scheduler | 1.57 | 1.73 |
| Warp cycles per issued instruction | 6.15 | 6.71 |
Both kernels have identical active warps per scheduler (3.87) - the same number of warps are alive. But Vectorize wastes fewer scheduler cycles (37.1% vs 42.3%). This is counterintuitive given that Vectorize also has fewer eligible warps (1.57 vs 1.73). The resolution: when Vectorize warps do stall, they stall for fewer cycles. Warp cycles per instruction is 6.15 for Vectorize versus 6.71 for Tiling - each instruction takes fewer cycles to complete in Vectorize because better coalescing means fewer cache replay transactions, which means shorter memory access latency, which means warps become eligible again sooner.
The A6000's scheduler can handle up to 12 warps per scheduler slot. Both kernels only give it ~4 active warps. This is the occupancy ceiling - there simply are not enough warps to hide the remaining memory latency through latency hiding.
Section: Launch Statistics and Occupancy
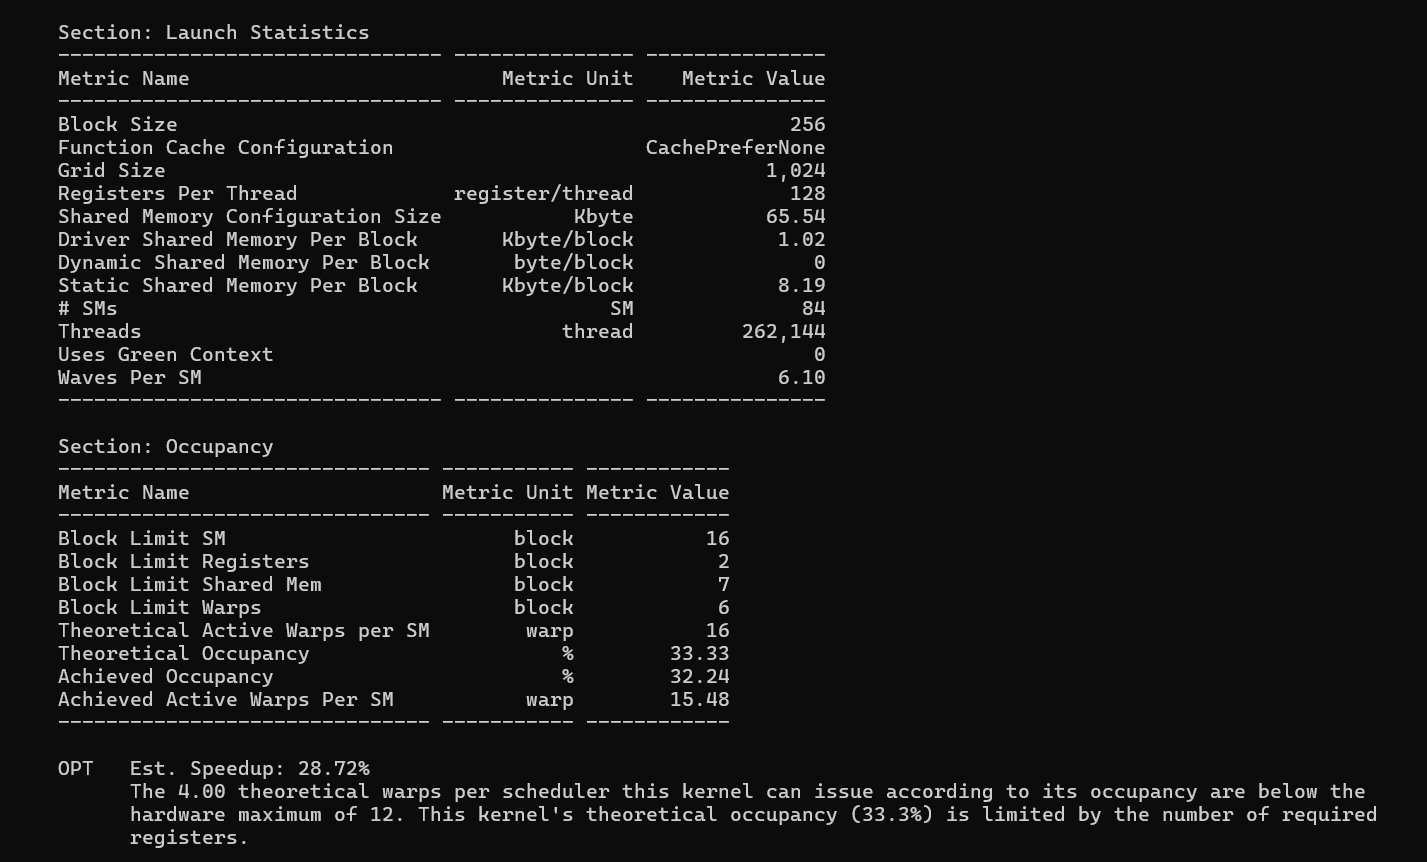
| Metric | Vectorize | 2D Tiling |
|---|---|---|
| Registers per thread | 116 | 128 |
| Block limit (register bottleneck) | 2 blocks/SM | 2 blocks/SM |
| Block limit (shared memory) | 7 blocks/SM | 7 blocks/SM |
| Theoretical occupancy | 33.33% | 33.33% |
| Achieved occupancy | 32.24% | 32.26% |
| Waves per SM | 6.10 | 6.10 |
Occupancy is limited by registers for both kernels. The A6000 SM has 65,536 registers. With 128 registers per thread × 256 threads per block = 32,768 registers per block, only 2 blocks fit per SM. This gives 2 blocks × 8 warps per block = 16 active warps out of a maximum 48, for 33.3% theoretical occupancy. Vectorize uses 116 registers per thread (29,696 per block), which still rounds up to the same 2-block limit - so both kernels have identical occupancy.
The 116 vs 128 register difference is meaningful for future tuning. If tile sizes were adjusted so that the per-block register budget dropped below 21,846 registers, Vectorize could fit 3 blocks per SM while Tiling could not - that would open a real occupancy gap. For this specific configuration (BM=BN=128, TM=TN=8), the ceiling happens to be the same.
Waves per SM is 6.10 for both: 1024 blocks / 84 SMs ÷ 2 blocks per SM = 6.1 waves. Each full wave is 84 SMs × 2 blocks = 168 concurrent blocks; 1024 / 168 = 6.1, meaning 6 full waves and a partial 7th wave.
Section: GPU Workload Distribution (Load Imbalance)
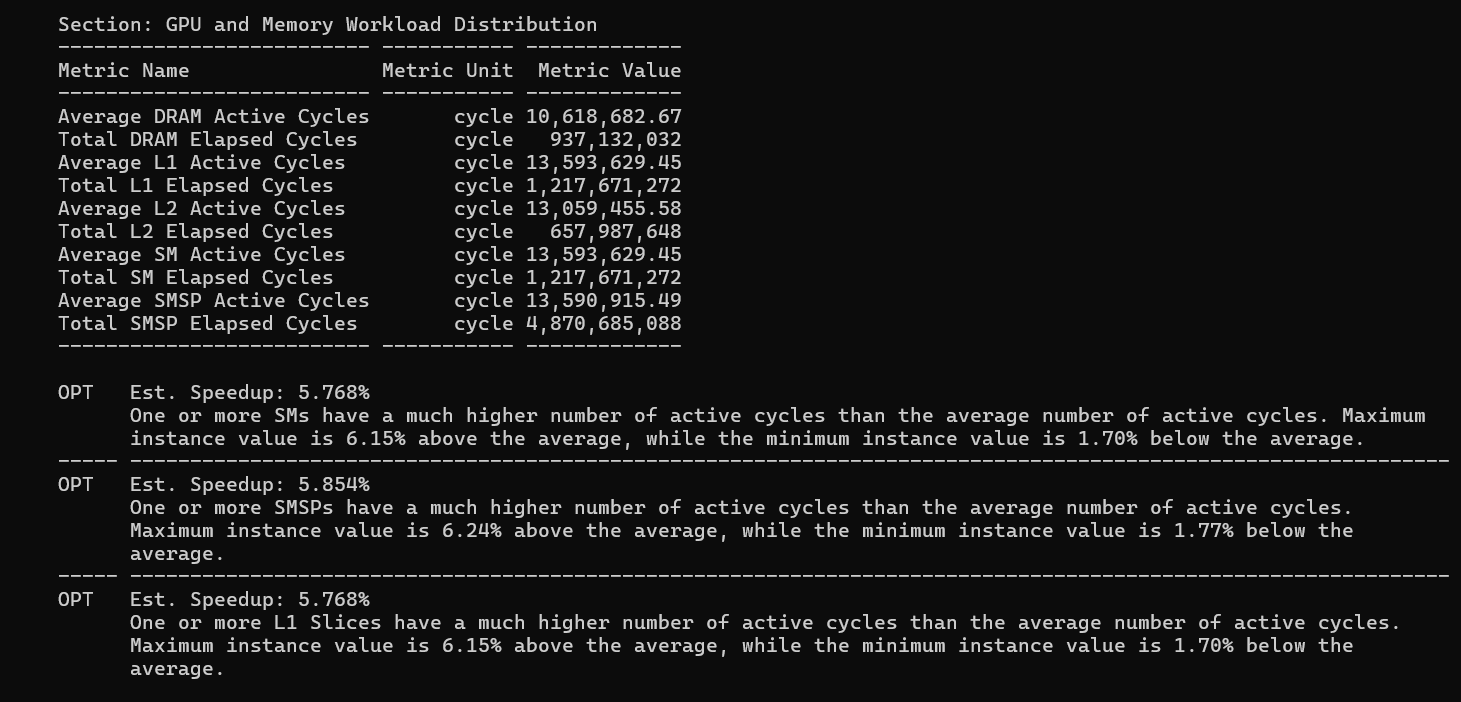
Both 4096 runs show a new warning not present in small-problem profiling: SM load imbalance. The hottest SM runs about 6.4% more active cycles than the average SM.
The cause: 1024 blocks does not divide evenly across 84 SMs. With 2 blocks per SM, you need 512 SMs to process all blocks simultaneously - but you only have 84. So blocks are distributed in waves: 84 SMs × 2 blocks/SM = 168 blocks per wave, for 6.095 waves. The partial last wave means 1024 − (6 × 168) = 16 blocks remain. These land on 16 SMs, leaving 68 SMs idle during the tail wave. The 16 "hot" SMs carry one extra block's worth of work and finish last - determining the kernel's end time. The ~6% penalty is the time the other 68 SMs are idle waiting for the last 16 to complete.
The fix: pad matrix dimensions to a multiple of 128 × 84 = 10,752 to ensure perfectly even distribution, or accept this ~6% tail-wave tax as inherent to the grid configuration.
Section: Source Counters
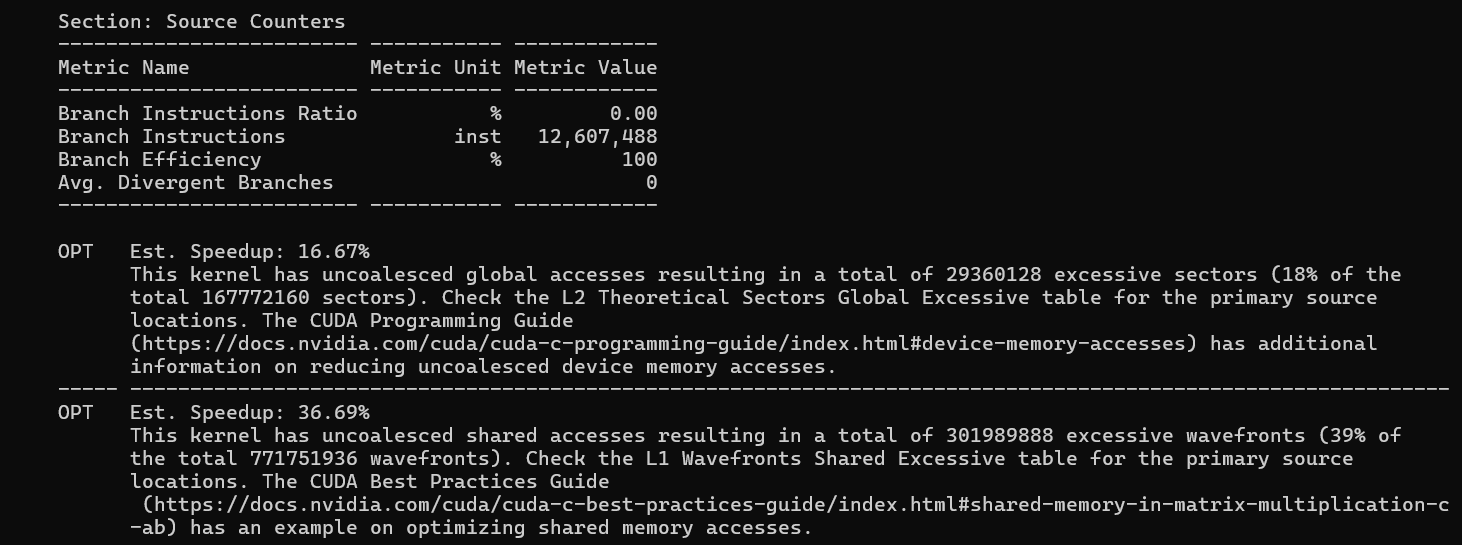
Branch Efficiency: 100% and Avg. Divergent Branches: 0 in both kernels. Every conditional in the code (the loop bounds, the tile index checks) is resolved identically for all threads in every warp. No warp divergence at all.
The uncoalesced global access summary confirms the coalescing picture from the Memory section. Tiling has 29.4M excessive sectors (18% of total), Vectorize has only 4.2M (3% of total). This 6× reduction in wasted global memory transactions is the primary mechanism behind the performance gap.
Head-to-Head Summary
| Issue | Vectorize est. speedup | 2D Tiling est. speedup | Fix |
|---|---|---|---|
| Global store coalescing | 39.4% | 62.4% | float4 stores (Vec already partial fix), transpose write-back |
| Shared load bank conflicts | 33.6% | 31.1% | Pad As and Bs: As[BM * (BK + 1)] |
| Shared store bank conflicts | 28% | - | Adjust float4 store pattern in Vec |
| Register pressure / occupancy | 66.7% | 28.7% | Reduce TM/TN or use __launch_bounds__ to hint the compiler |
| Global load coalescing | 2.5% | 16.5% | float4 loads (Vec already did this) |
| Tail-wave imbalance | ~6% | ~5.8% | Pad matrix to multiple of 128 × 84 |
Key Takeaways
1. Always use nsys before ncu. nsys told us that 100% of GPU time is in our kernel, that memory transfers are a one-time cost outside the hot loop, and that the vectorize kernel runs consistently at ~7.6ms per launch. Only after establishing this system-level picture does ncu's deep dive become interpretable.
2. Both kernels are memory-bound, not compute-bound. L1/TEX throughput is the dominant bar in the Speed of Light chart for both. The roofline puts Vec at 52% of FP32 peak and Tiling at 44% - both sitting on the memory bandwidth slope. Optimizing the inner FMA loop would do nothing; the bottleneck is how fast data arrives from the cache hierarchy.
3. float4 loads solved the global load coalescing problem. Uncoalesced excess dropped from 18%
(Tiling) to 3% (Vec). A single float4 load brings in 4 floats in one aligned 128-bit
instruction, and when 32 threads each issue one, the entire warp's tile row is covered in one transaction.
4. The write-back to C is the largest remaining opportunity in Tiling. 4.0/32 bytes used per store sector means 87.5% of every cache line fetch-for-write is wasted. Vectorize improved this to 16.0/32 using float4 stores, but the strided row-by-row write pattern still leaves half of each sector unused. A proper fix requires either transposing the thread-to-output mapping or implementing a dedicated store stage.
5. Shared memory bank conflicts are the biggest unfixed problem in both kernels. ~40% of shared
load wavefronts are conflict-induced in both. The fix is one line of code: add a single float of padding to the
row stride of As and Bs. The estimated 31–34% speedup
from this single change makes it the highest-priority optimization left.
6. Occupancy is register-bound and identical for both. 128 registers (Tiling) and 116 registers (Vectorize) per thread both yield exactly 2 blocks per SM and 33.3% theoretical occupancy. Vectorize's lower register count provides no occupancy benefit at this tile size - but it would at different tile configurations, making it a useful investment for future tuning.
7. The path to cuBLAS-level performance is clear. Fix shared bank conflicts (padding), fix global store coalescing (float4 stores with proper layout), and push occupancy above 50% (reduce register pressure). These three changes in combination would bring both kernels from ~50% peak performance much closer to cuBLAS-like throughput.
References
- Simon Boehm: How to Optimize a CUDA Matmul Kernel
- NVIDIA: Nsight Systems Documentation and Nsight Compute Documentation
- NVIDIA: CUDA C Programming Guide (CUDA Basics)
Have questions, corrections, or want to discuss GPU optimization? Feel free to reach out via email at vinayrjumani@gmail.com or connect with me on LinkedIn.